
Squadmakers  /  Squad Master AI

SQUAD MASTER AI

Central square with letter 'S' connected by lines to icons representing artificial intelligence, data graph, user, and coding symbols, illustrating technology and software concepts.
Core product · daily tracking
Get the true view of your project, clear even for a non-technical manager.

Rome wasn’t built in one day — consistency is what makes engineering teams succeed. Squad Master AI tracks progress daily. It translates technical progress and code quality into the real state of the project, scoring every merge request and developer across GitLab and GitHub. Works with any team, not only squads managed by Squadmakers.
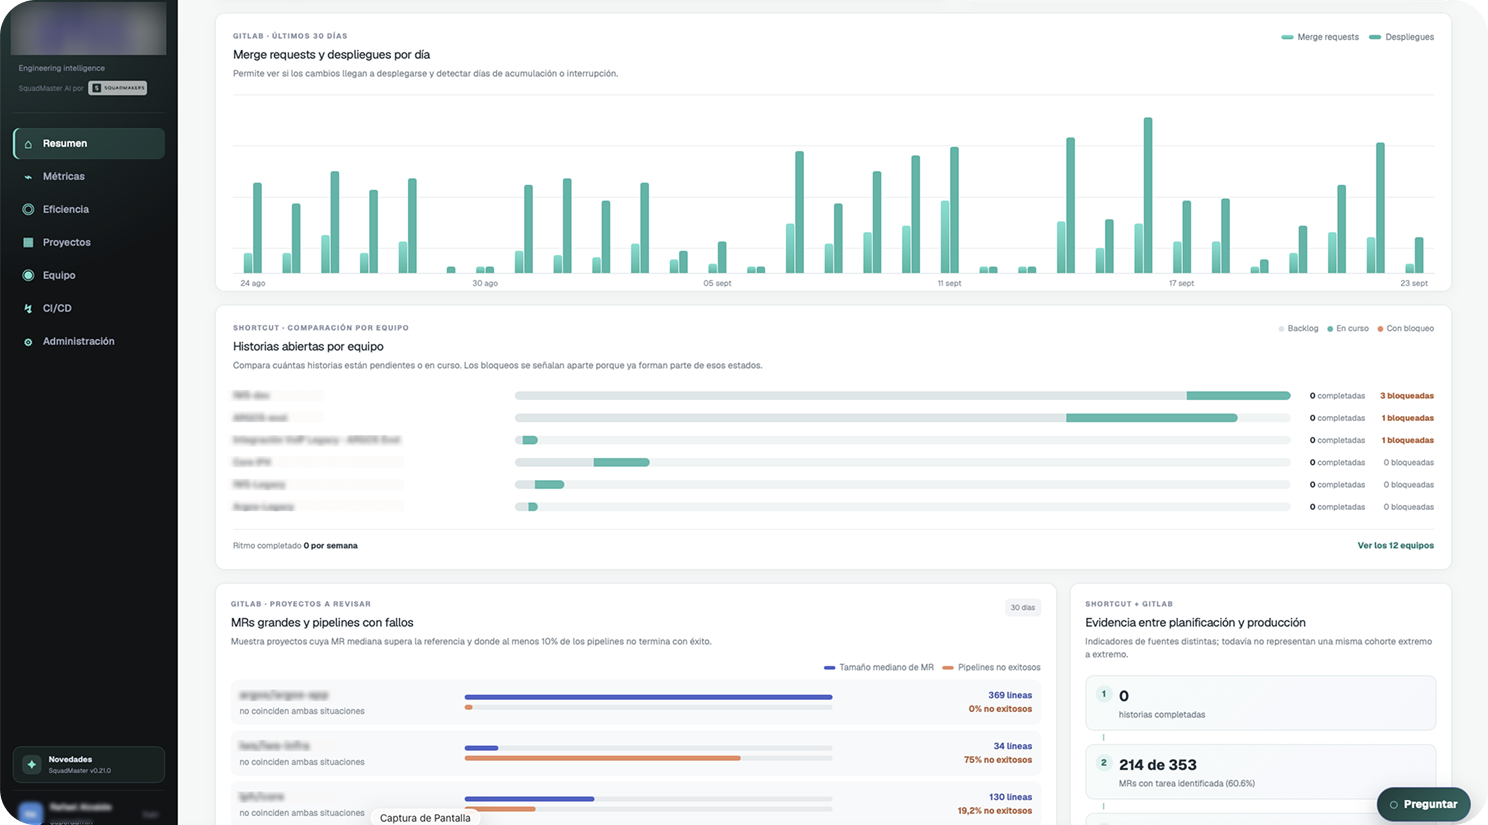
Dashboard interface displaying engineering intelligence data with sections for merge requests and deployments per day in a bar chart, open stories per team in a horizontal stacked bar chart showing backlog, in progress, and blocked statuses, large merge requests and failing pipelines with colored bars representing median MR size and unsuccessful pipelines, and evidence between planning and production showing number of completed stories and identified MR tasks, all in Spanish with a dark sidebar menu featuring options like Summary, Metrics, Efficiency, Projects, Team, CI/CD, and Administration.

Squad Master AI continuously monitors how a software project is really progressing — delivery pace, code quality, CI/CD stability and team participation — and flags risks like technical debt, blockers or delays before they hit the roadmap. Built for projects run by the client themselves, with internal, external or mixed teams. It improves speed and predictability without replacing human leadership: the platform brings the evidence, the decisions stay with your team.

Green circular arrow forming a clockwise loop, symbolizing refresh or reload action.
Visibility without manual reporting.

An always-updated view of merge requests, reviews, pipelines, deployments and stories — instead of hours spent preparing status reports.

Blue trash bin icon with a white recycling symbol on it.
Risk before it escalates.

Blockers, oversized merge requests, failing pipelines or untracked work surface early in “What to review now”.

Small blue star icon with a five-pointed star shape in the center.
AI-assisted reading.

An “Analyze” action gives a diagnosis for each view, plus an “Ask” assistant to query your data in plain language.

Who it’s for

A stylized green recycling symbol with three arrows forming a triangle, representing sustainability and recycling.
CTOs, Engineering Managers & project directors

Who need to know how the project is really going, without relying on impressions or status meetings.

Icon showing green hands cupping a large green leaf above a smaller plant with three leaves, symbolizing environmental care or sustainability.
Squad Leads & Project Managers

Who want to catch bottlenecks in review, CI/CD or planning early.

Icon of six blue blocks stacked in an offset grid formation with three-dimensional shading on a transparent background.
Leadership & business stakeholders

Who need an executive read of the period, understandable without a technical background.
Data sources

Source What it brings
GitLab & GitHub Commits, MR's, reviews and approvals, pipelines, jobs and deployments. Own scoring engine for code quality, per MR and per contributor.
Shortcut and Jira Pending, in-progress, blocked and completed stories by team; traceability between planning and delivered code.
Other tools Bitbucket and others require a prior technical review before they’re supported.
Product views

Inside the platform

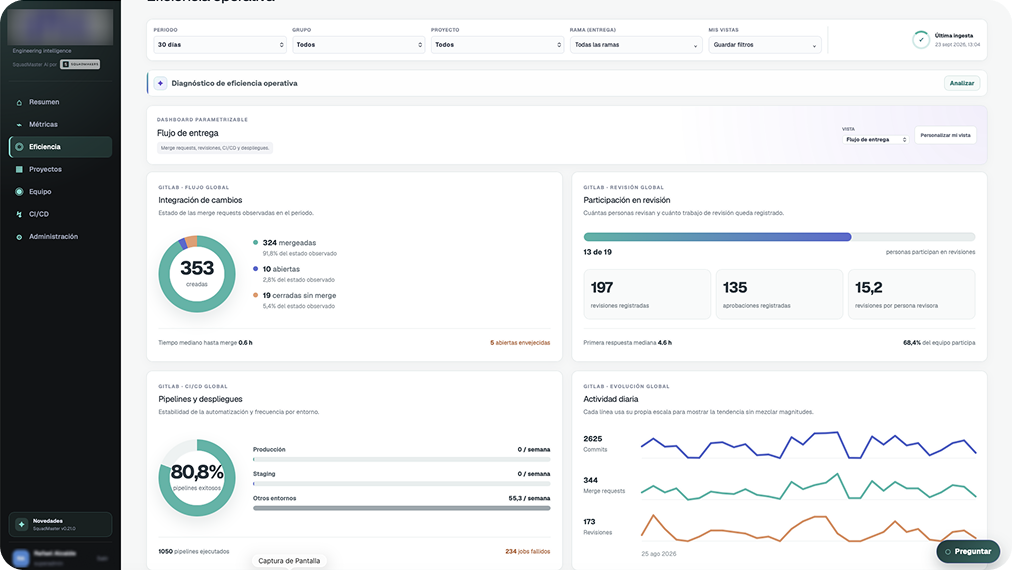
Dashboard interface showing operational efficiency metrics, including delivery flow, change integration with 353 merge requests, 324 merged, 10 open, 19 closed without merge, and pipelines with 80.8% success rate. Also displays review participation with 13 of 19 people, 197 reviews recorded, 135 approvals, 15.2 reviews per reviewer, and daily activity graphs for commits, merge requests, and reviews from August 25 to September 23, 2026. Filters for period, group, project, branch, and personal view are at the top. Left sidebar includes navigation options in Spanish.
Summary

How key indicators evolve day to day, what actions were logged in the period, and a “What to review now” list ranked by impact.
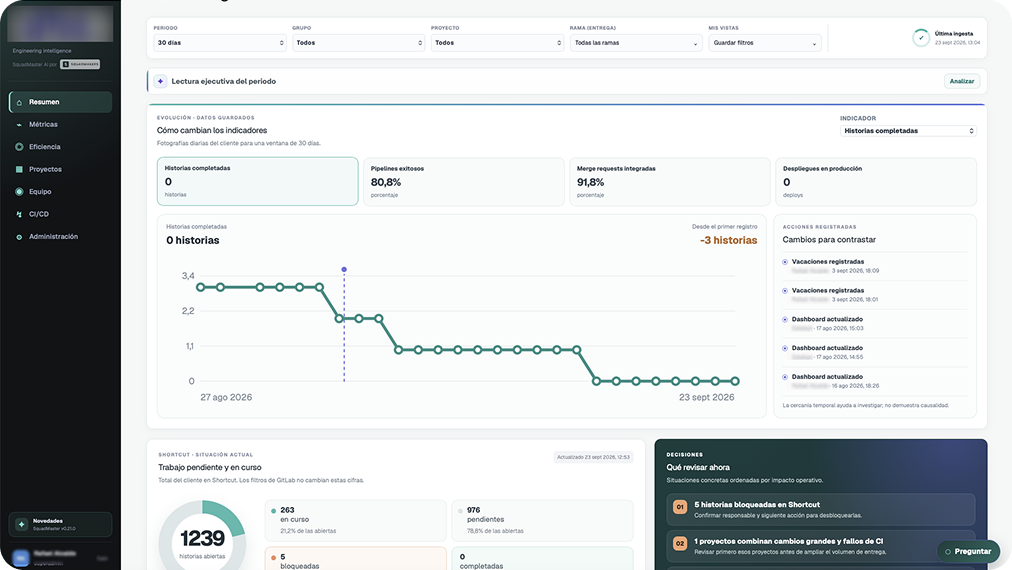
Dashboard interface showing engineering intelligence metrics including completed histories, successful pipelines at 80.8%, merge requests integrated at 91.8%, and zero deployments in production over a 30-day period. A line graph charts completed histories declining from 3.4 to 0 between August 27, 2026, and September 23, 2026. The interface includes sections for current pending and ongoing work with 1239 open histories and detailed statuses. On the right, recent recorded changes are listed, including registered vacations and dashboard updates with timestamps. The sidebar menu contains options like Summary, Metrics, Efficiency, Projects, Team, CI/CD, and Administration.
Operational efficiency

Merge request status and median time to merge, review participation and first-response time, pipeline stability, deploy frequency and daily activity.
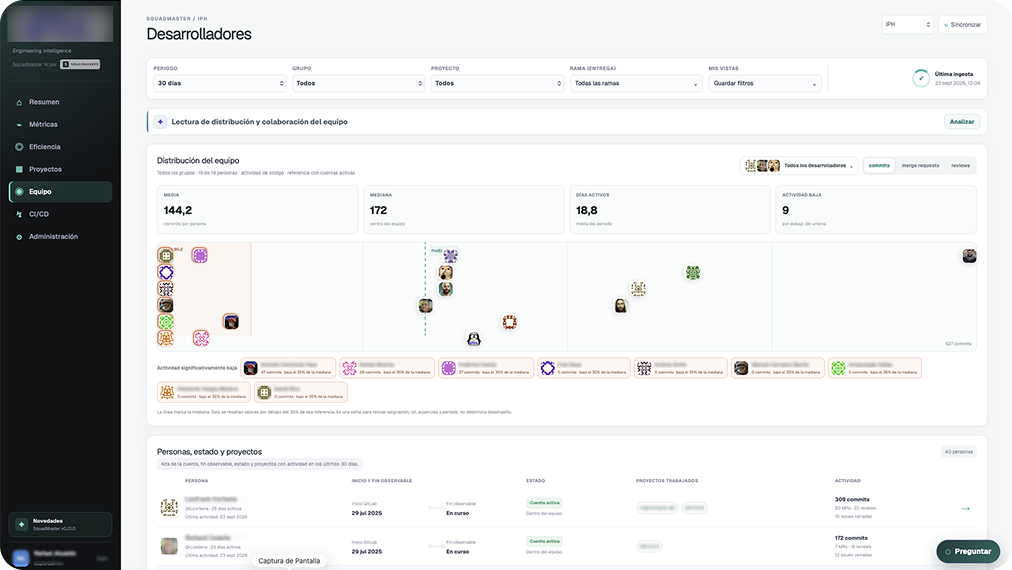
Dashboard interface titled 'Desarrolladores' showing team distribution and collaboration metrics for software developers over a 30-day period, with filters for group, project, and branch. The main section displays a graph indicating commits per person versus the team center, highlighting significantly low activity below the median with user avatars distributed across activity levels. Summary stats include average commits per person (144.2), median commits (172), active days (18.8), and low activity days (9). Below is a list of people with their status, projects worked on, and commit counts. The sidebar includes navigation links to Resumen, Métricas, Eficiencia, Proyectos, Equipo, CI/CD, and Administración. A chat button labeled 'Preguntar' is visible in the bottom right.
Team

How code activity is distributed across the team and which projects each person works on.

A stylized green recycling symbol with three arrows forming a triangle, representing sustainability and recycling.

Responsible use of data. Squad Master AI never equates more commits with more productivity, and it doesn’t generate people rankings. Metrics are signals meant to open conversations with context. Access is through nominal accounts of your organization, and if you don’t continue after the pilot, data is returned or deleted as agreed.

Why choose it

Green check mark symbol on a transparent background.

Works with any squad — not only Squadmakers-managed teams

Green check mark symbol on a transparent background.

Own scoring engine, per merge request and per contributor

Green check mark symbol on a transparent background.

Technical-debt and delay signals, not vanity metrics

Green check mark symbol on a transparent background.

No commit-count-equals-productivity assumptions

Green check mark symbol on a transparent background.

“Analyze” and “Ask” AI assistant built in

Green check mark symbol on a transparent background.

Nominal user accounts — no per-seat cost

Pricing

Starter

$173/mo

One-time Setup $291 · First Invoice $464

  • ✓ Up to 10 contributors analyzed
  • ✓ Up to 3 repositories connected
  • ✓ 100 AI queries/month
Book a demo

Scale

$639/mo

One-time Setup $582 · First Invoice $1,220

  • ✓ Up to 50 contributors analyzed
  • ✓ Up to 25 repositories connected
  • ✓ 2,000 AI queries/month
Start the pilot

Enterprise

Custom

Talk to sales

  • ✓ Custom scope, agreed together
  • ✓ Dedicated support
  • ✓ Security review and SSO options
Talk to sales
Prices in USD, excluding VAT. Invoiced in USD or the equivalent in your currency.
Not sure yet? Start with a pilot

A 60-day pilot with your own data

The pilot exists to answer one concrete question: does Squad Master AI bring measurable value to your team? We agree upfront what we’ll measure and when we’ll decide.

Price $570 + VAT, fixed price, paid upfront
Duration 60 calendar days from platform activation
Scope included Team tier: up to 25 contributors analyzed, 5 repositories connected and 500 AI queries per 30-day block
Implementation Standard setup included: connecting existing integrations, configuring scope and access, initial data validation
Guided support Kickoff session (up to 60 min), mid-point review (up to 30 min) and final results session (up to 60 min)
Users Nominal accounts for your organization, no per-seat cost
Not included Custom development, new integrations, migrations or extensive data cleanup
How it unfolds
A circular teal checkmark icon inside a white circle with a thin teal border.

Before kickoff — Starting point, 2–3 success criteria, who decides, plan for after the pilot

A circular teal checkmark icon inside a white circle with a thin teal border.

Day 0 — Platform activation and kickoff session with the team lead

A circular teal checkmark icon inside a white circle with a thin teal border.

Day 30 — Mid-point review: real usage, friction points and adjustments

A circular teal checkmark icon inside a white circle with a thin teal border.

Day 45 — Evidence gathered, the right-sized scope and continuity proposal

A circular teal checkmark icon inside a white circle with a thin teal border.

Day 60 — Final session and decision: continue or close

Is the pilot right for you?
A circular teal checkmark icon inside a white circle with a thin teal border.

There’s a concrete problem you want to solve

A circular teal checkmark icon inside a white circle with a thin teal border.

A technical owner will take part in the sessions

A circular teal checkmark icon inside a white circle with a thin teal border.

We can access the repositories you use

A circular teal checkmark icon inside a white circle with a thin teal border.

There’s potential budget to continue if the pilot works

A circular teal checkmark icon inside a white circle with a thin teal border.

The continuity decision can be made at the end of the 60 days

A stylized green recycling symbol with three arrows forming a triangle, representing sustainability and recycling.

If you continue, your subscription starts on day 61 on the plan matching your scope. The setup fee is waived and integrations stay the same.

Green upward trending arrow with a dollar sign, representing financial growth or profit increase.

Other paths: skip the pilot and contract directly, or compare a direct Starter contract for small teams.

How we measure value

Monthly benefit = hours actually freed up × internal cost per hour

ROI = (benefit − cost) / cost, including subscription and your team’s operating time.

Illustrative example: If a team frees up 13 h/month at $50/hour, that's $650 of recovered capacity against a $348 Team plan: $302 net benefit and 87% ROI. The subscription pays for itself from roughly 7 freed hours a month.

Common questions

FAQ

No. Squad Master AI works with any software team, whether it is internal, external or mixed. It is built for projects that the client manages directly. It connects to your own GitLab or GitHub repositories (and to Shortcut, if you use it), so you do not need to hire a Squadmakers squad to use it.
The pilot is a 60-day guided trial with your own data, for a fixed price of $570 + VAT paid upfront. It includes Team-level scope (up to 25 contributors, 5 repositories and 500 AI queries per 30-day block), the standard setup, and three sessions with our team: a kickoff, a mid-point review and a final results session. Before it starts we agree two or three success criteria and who decides at the end. On day 60 you choose to continue or to close the pilot, with no further commitment. If you continue, your subscription starts on day 61 on the plan that fits your scope, and the setup fee is not charged again if the configuration stays the same. The pilot fee pays for the work done during those 60 days and is not deducted from later subscription fees. Contracting directly skips the pilot. You start the monthly subscription right away and pay the one-time setup fee, for example $348 per month plus $407 setup for the Team plan. It suits teams that already see the value. For small teams (up to 10 contributors and 3 repositories) we recommend a demo followed by a direct Starter plan.
No. Squad Master AI does not rank people and does not treat the number of commits as productivity. It does not yet give a single productivity KPI: one is being tested with several clients to refine the figure. What it gives today is a set of KPIs that help estimate productivity, such as the quality of the code in each merge request and per contributor, the flow of merge requests and reviews, pipeline stability, and how code activity is spread across the team. Leads use them to spot review bottlenecks, unbalanced assignments or blocked work. A low-activity signal is a reason to check assignment, role, absences or the period being viewed. It does not determine anyone's performance. The metrics are meant to open conversations with context, and access is through named accounts of your organization.
Squad Master AI reads activity from GitLab and GitHub: commits, merge and pull requests, reviews and approvals, pipelines, jobs and deployments. It adds its own evaluation of code quality per merge request and per contributor. It also connects to Shortcut, where it reads pending, in-progress, blocked and completed stories by team, so planning can be traced to the code that was delivered. Other tools, such as Jira or Bitbucket, need a technical review by our team before we can commit to supporting them.
If you don't continue after the pilot, we end your access when it finishes. Your data is deleted after a safekeeping period of 3 months from the cancellation of your account. You can request a backup of the data we have managed for you, as long as you have no pending payments. There is no minimum term and no later charges.
All Squadmakers services are invoiced in US dollars, or in the conversion of that value to your own currency. Prices on the site are in USD and exclude VAT. If you prefer to be invoiced in another currency, the amount is the USD price converted to that currency. Annual billing takes 10% off the subscription (Starter $1,872, Team $3,757 and Scale $6,897 per year), and your base rate is guaranteed for 12 months while your scope stays the same. Squad Challenge packs are also priced in US dollars, as one-time purchases.
See it on your own repos

Book a 45-minute walkthrough, or start the focused pilot and measure the value with your own engineering data.